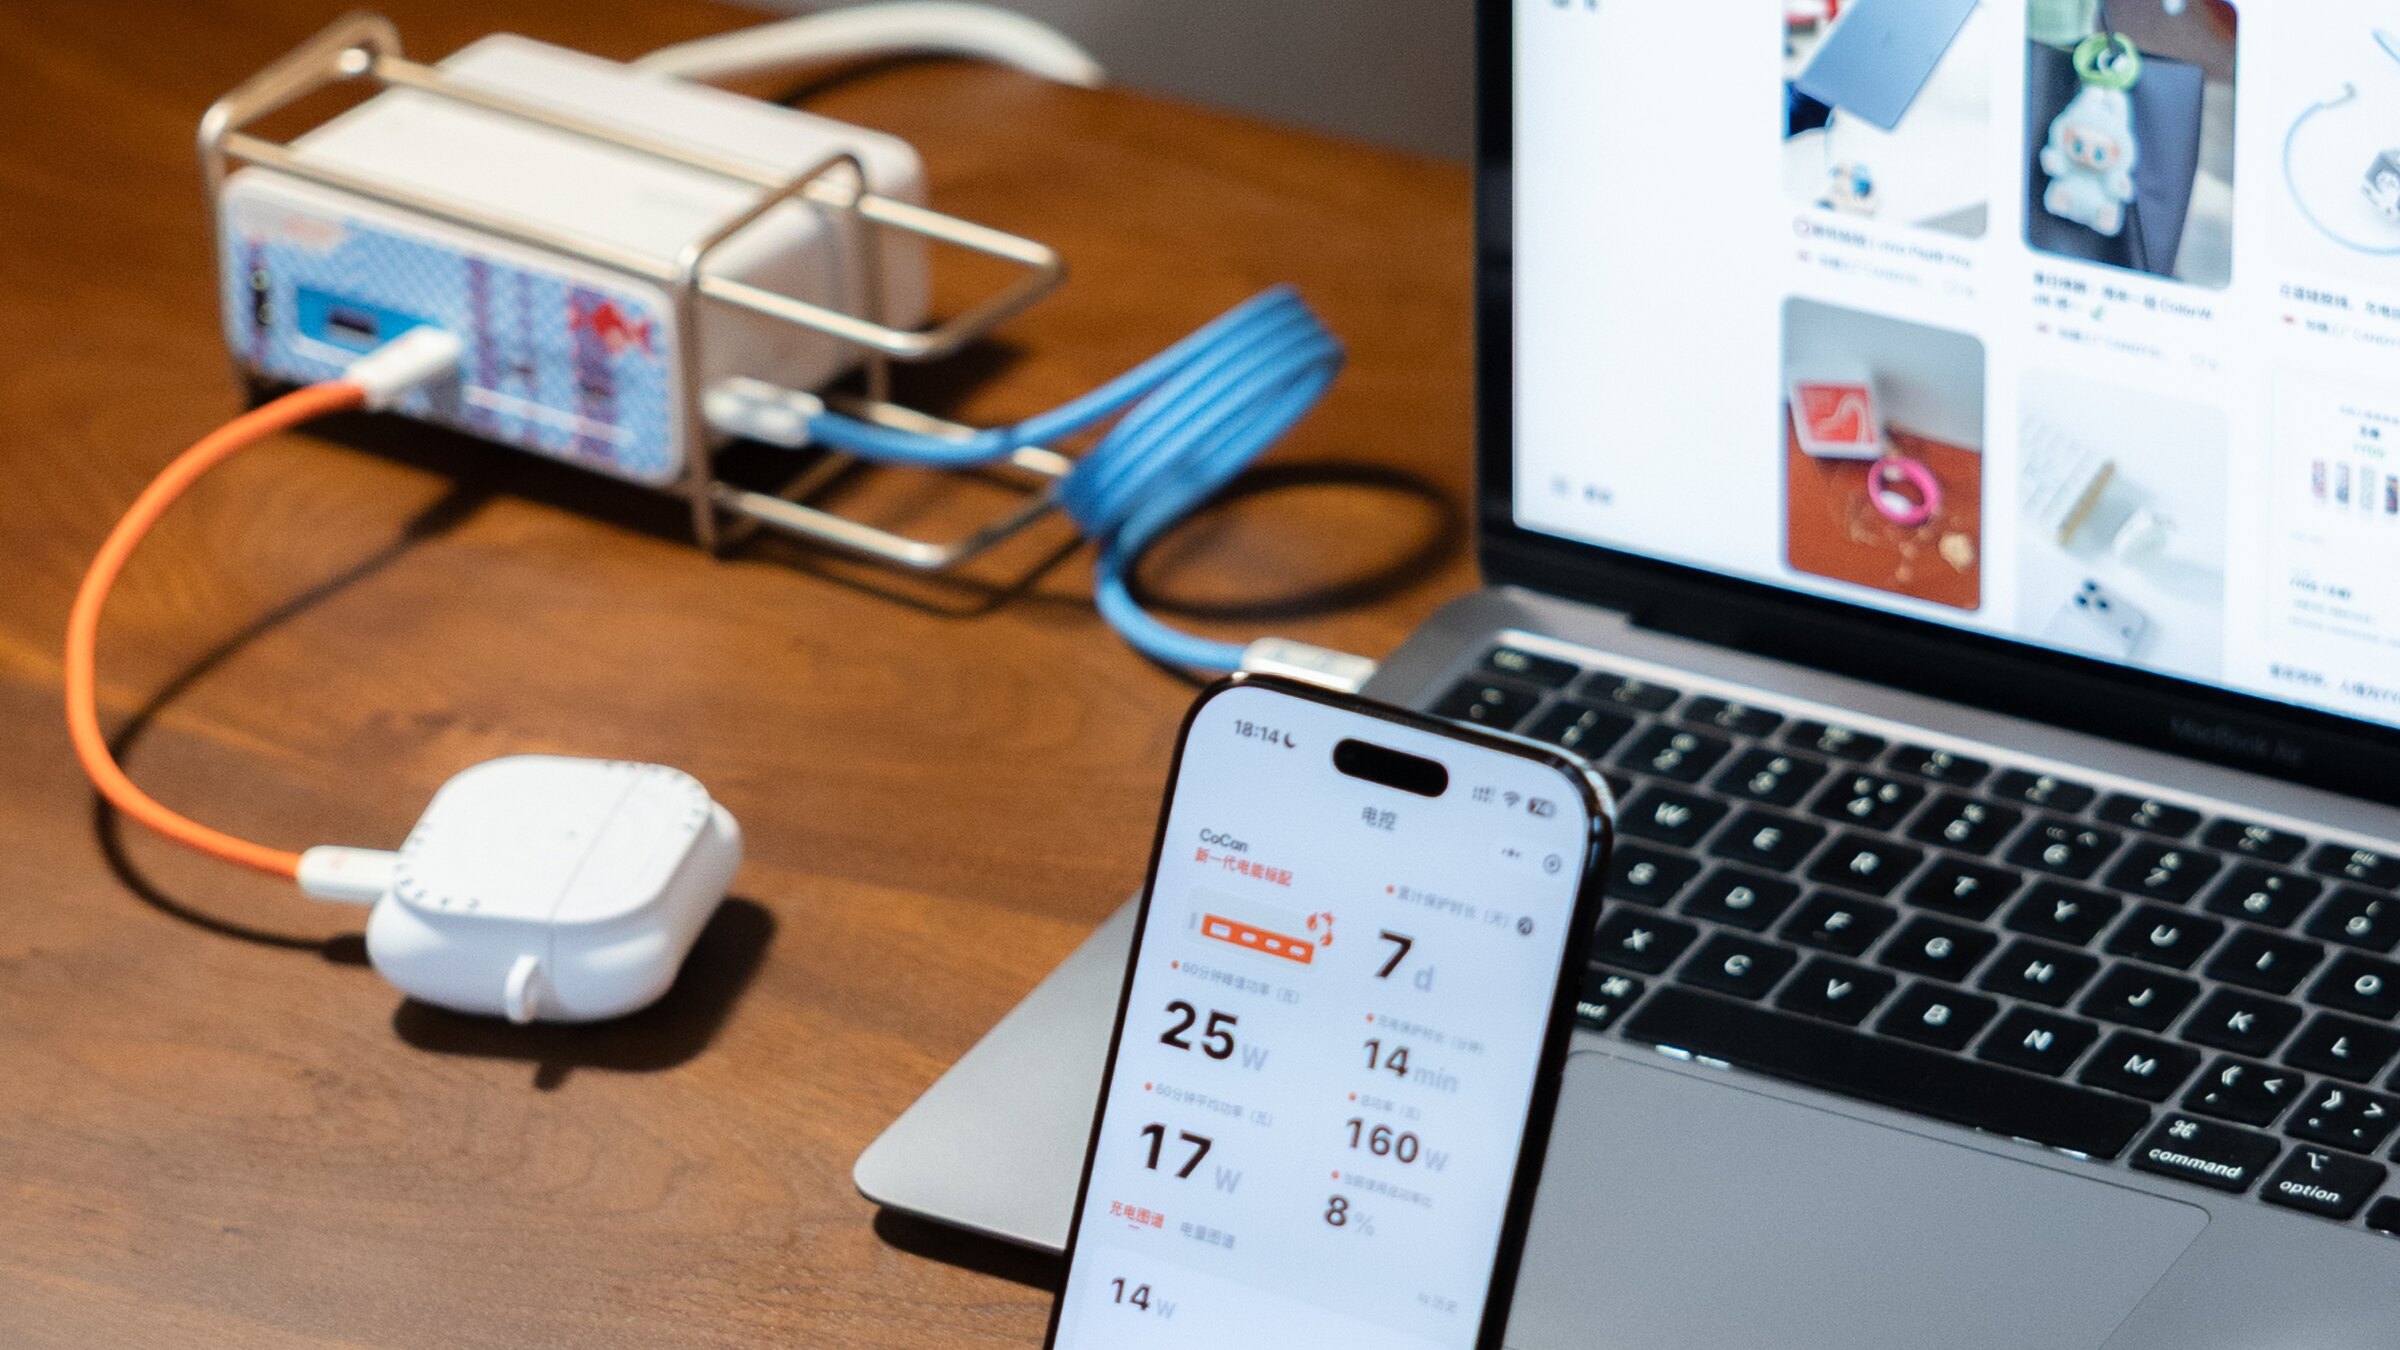
A port stuck at 45W, a phone quietly slowing after a laptop plugs in, power shifting the moment you swap a cable — one number on a screen cannot explain these. You need port, protocol, power, temperature, and system events side by side, and Mirror folds all of them into telemetry.
Telemetry covers boot info, firmware versions, memory, temperature, network, MQTT, historical power, live allocation, port statistics, PD pcap, OTA progress, config sync, task results, and alerts. One dataset explains what is happening right now and gives you enough to trace it to root cause.
That transparency makes every FluxAI® scheduling decision traceable and third-party integration smoother. Build your own dashboard, write automation rules, keep a charging log — and when something goes wrong, tell whether it came from the device, the cable, the protocol, temperature, or strategy.